 Technopulse


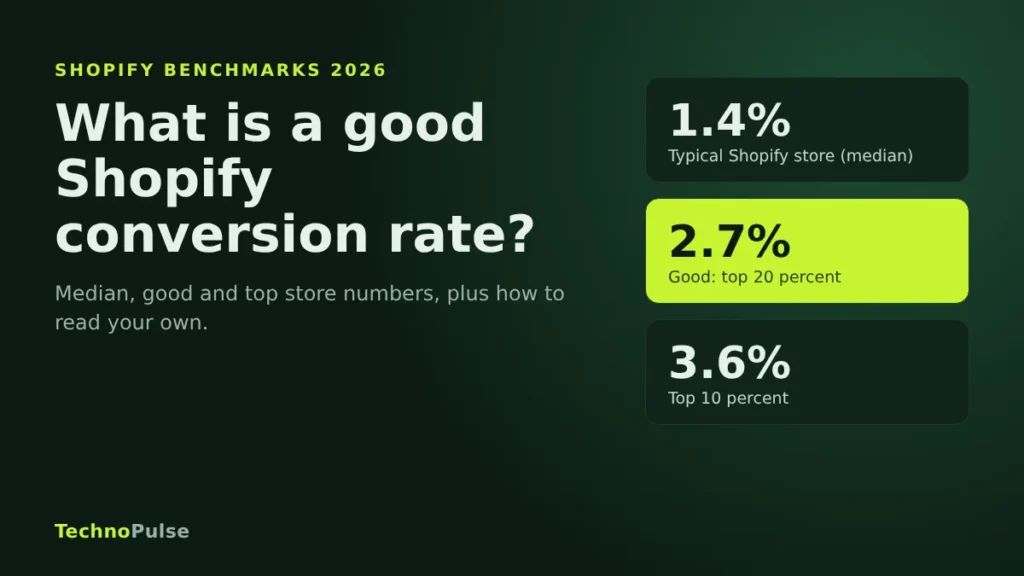
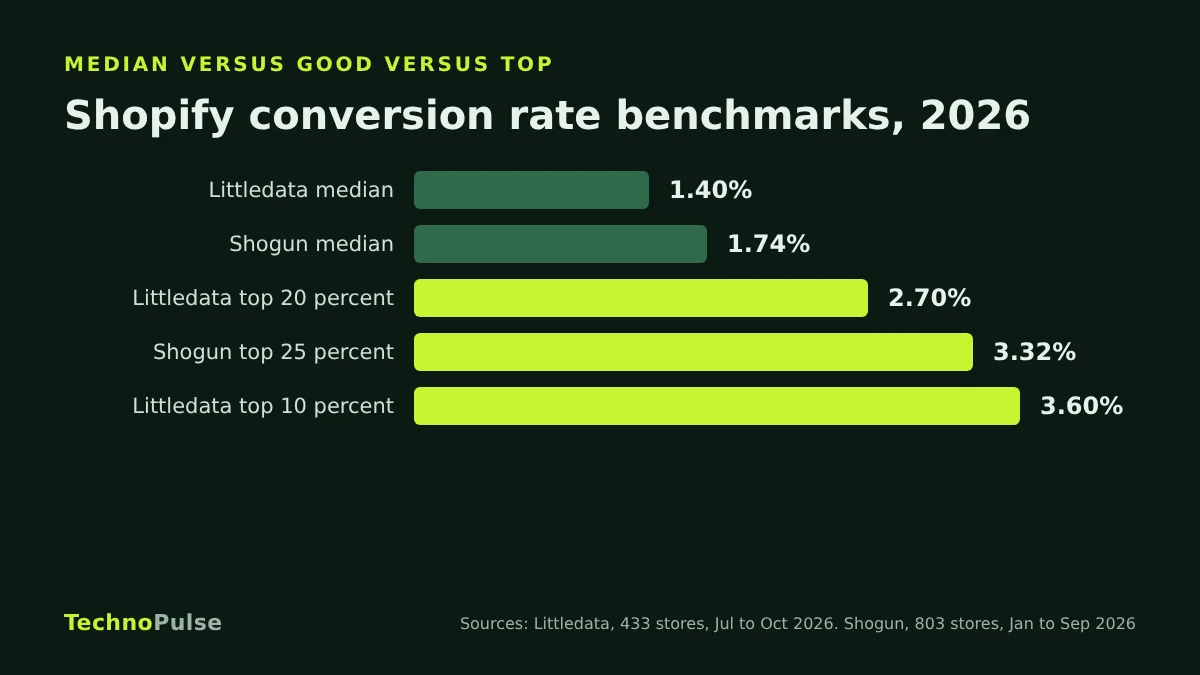
A good Shopify conversion rate in 2026 is about 2.7 to 3.3 percent of sessions, which puts a store in the top quarter to top fifth of Shopify stores. The typical store converts 1.4 to 1.7 percent, and anything above 3.6 percent is top 10 percent territory.
That is the short answer. The useful answer is that “good” depends on what you sell, what you charge, where your traffic comes from, and even on how Shopify counted your sessions this autumn. I review conversion data on Shopify stores every week, and the founders who improve fastest are the ones who stop chasing an industry average and start reading their own funnel. This guide gives you the current benchmarks, explains why they disagree, and shows you how to judge your own number.
Key takeaways
- The median Shopify store converts 1.4 percent (Littledata) to 1.74 percent (Shogun) of sessions in 2026.
- Good means roughly 2.7 to 3.3 percent. Top 10 percent of stores reach 3.6 percent or more.
- Category matters more than any single average: health and beauty stores convert more than twice as often as sports and outdoor stores.
- Shopify changed how it counts sessions between 21 and 23 September 2026, so your rate may have moved without any change to your store.
- Judge your store on three funnel steps, split by device, not on one headline number.
Shopify conversion rate benchmarks for 2026
Two benchmark sets are worth using because they are built only from Shopify stores and they publish their method.
| Benchmark | Median | Good | Top | Sample |
|---|---|---|---|---|
| Littledata | 1.4% | 2.7% (top 20 percent) | 3.6% (top 10 percent) | 433 Shopify stores, 90 days to 17 October 2026 |
| Shogun | 1.74% | 3.32% (top 25 percent) | Mean 2.54% | 803 Shopify stores, January to September 2026 |
You can check both at the source: Littledata’s live Shopify conversion benchmark and Shogun’s Shopify conversion rate report. Littledata refreshes its numbers regularly, so the figures above are the ones it published on 21 October 2026.
Notice the gap between Shogun’s median of 1.74 percent and its mean of 2.54 percent. A small group of very strong stores pulls the average up. That is why the median is the honest “typical store” number, and why an “average conversion rate” quoted without context can make an ordinary store feel like it is failing.
Why every benchmark gives a different number
Search for “average ecommerce conversion rate” and you will see anything from under 2 percent to almost 3 percent. None of them is wrong. They measure different things.
- Different stores. Dynamic Yield puts global ecommerce conversion at 2.68 percent over the past twelve months, but its customers are mostly larger retailers across many platforms, not small Shopify brands.
- Different definitions. Dynamic Yield divides purchases by visitors. Shopify, Littledata and IRP Commerce divide by sessions. One visitor can have several sessions, so a per session rate is usually lower.
- Different periods. IRP Commerce reported 1.97 percent for September 2026, up from 1.68 percent a year earlier. A single month swings with seasons and promotions.
The practical rule: compare yourself with a benchmark built from Shopify stores, measured per session, over a recent period. For most DTC brands that means the Littledata and Shogun numbers above.
Your conversion rate changed in September 2026, and it may not be you
This is the part most benchmark articles miss. Shopify rolled out a session measurement update between 21 and 23 September 2026. Three things changed:
- Sessions now end after 30 minutes of inactivity instead of at midnight UTC.
- Some sessions with no pageview now count, for example a shopper who goes straight to checkout from a cart link.
- Identified bot sessions are filtered out of session reports by default.
Because conversion rate is orders divided by sessions, your rate can move even if orders and sales stay exactly the same. Removing bots lowers the session count and lifts the rate. Counting pageview free sessions does the opposite. Shopify’s own advice is to treat data after the update as a new baseline. In practice, when a founder tells me their conversion rate “jumped” or “dropped” in late September, the first thing we check is this update, before anyone touches the theme.
So if you compare October 2026 with October 2025, add a note to your report. Compare revenue per session and orders as well, because those numbers tell you whether anything real changed.
Shopify conversion rate by industry
What you sell has more effect on your rate than almost anything you can change on the site. Shogun’s 2026 data shows a gap of almost three times between the strongest and weakest categories.
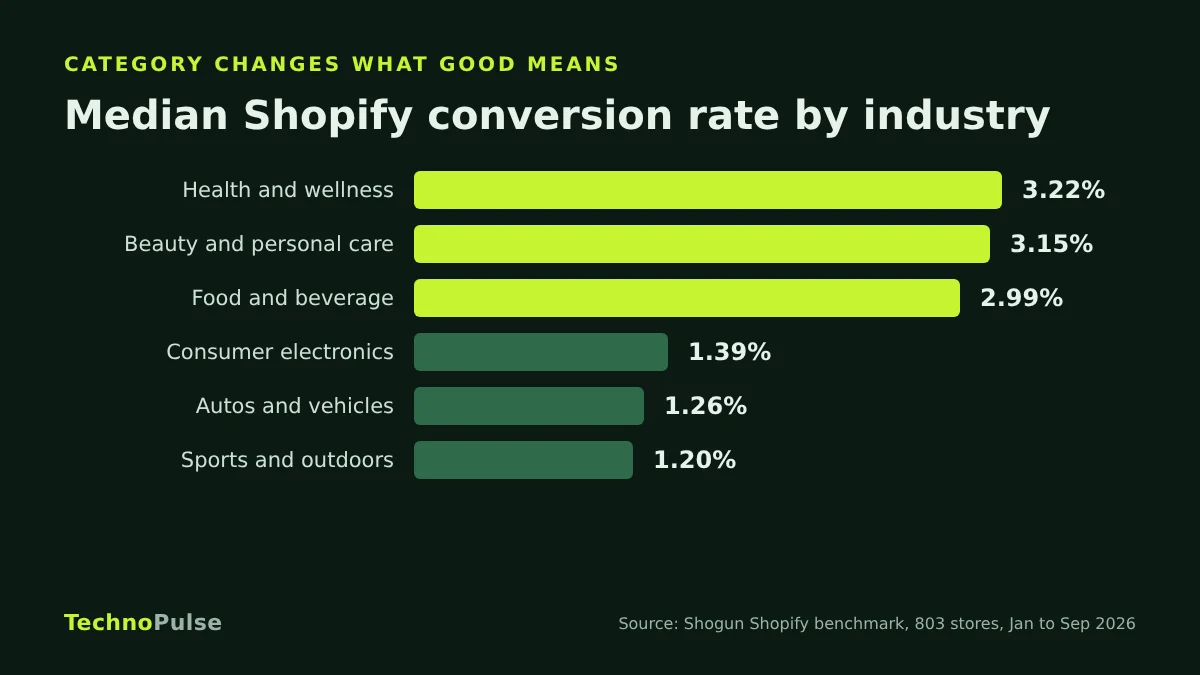
- Health and wellness: 3.22 percent median
- Beauty and personal care: 3.15 percent
- Food and beverage: 2.99 percent
- Consumer electronics: 1.39 percent
- Autos and vehicles: 1.26 percent
- Sports and outdoors: 1.20 percent
The pattern is simple. Low price, repeat purchase products such as supplements, skincare and snacks convert well because the decision is small and many buyers are returning customers. Expensive, considered purchases such as tents, bike parts and electronics convert lower because shoppers compare, leave and come back. Dynamic Yield’s data shows the same shape across retail, with luxury and jewelry at only 0.69 percent.
That means a 2 percent outdoor gear store may be doing better than a 2.5 percent supplement store. Always benchmark against your own category first.
Other things that change what “good” looks like
Average order value
A store selling a 30 dollar product and a store selling a 900 dollar product should not have the same target. As price goes up, conversion rate usually goes down and revenue per session becomes the better measure.
Traffic source
Returning visitors from email and SMS convert far better than cold visitors from a new Meta prospecting campaign. If you scale paid social, your blended rate will often fall even while revenue grows. That is normal, as long as cost per order still works.
Device
On most of the Shopify stores we audit, the majority of sessions are on mobile, so your mobile rate decides your overall rate. Dynamic Yield reported mobile at 2.86 percent and desktop at 2.23 percent across its retailers in September 2026, but many smaller Shopify stores still see desktop convert higher. Check your own split and fix whichever device is losing more revenue.
How to find your real conversion rate in Shopify
In Shopify admin go to Analytics, then Reports, and open Conversion rate over time and Conversion rate breakdown. According to Shopify’s report definitions, the funnel has four steps:
- All sessions, the denominator for every step.
- Sessions with cart additions, where a shopper added a product to the cart.
- Sessions that reached checkout, where the shopper interacted with checkout, such as a key press or click.
- Sessions that completed checkout, where a purchase was made.
Your conversion rate is step 4 divided by step 1. A session can contain more than one order, so this number will not match your order count exactly. That is expected.
Read the funnel, not the headline number
One number cannot tell you what to fix. Three ratios can:
- Sessions to add to cart. Low here means the problem is before the cart: speed, product page clarity, price, offer or traffic quality.
- Add to cart to reached checkout. Low here points at the cart: surprise shipping costs, no delivery date, a cluttered cart drawer or a weak free shipping threshold.
- Reached checkout to completed. Low here points at checkout: missing express payment options, forced account creation, or payment and shipping problems in certain countries.
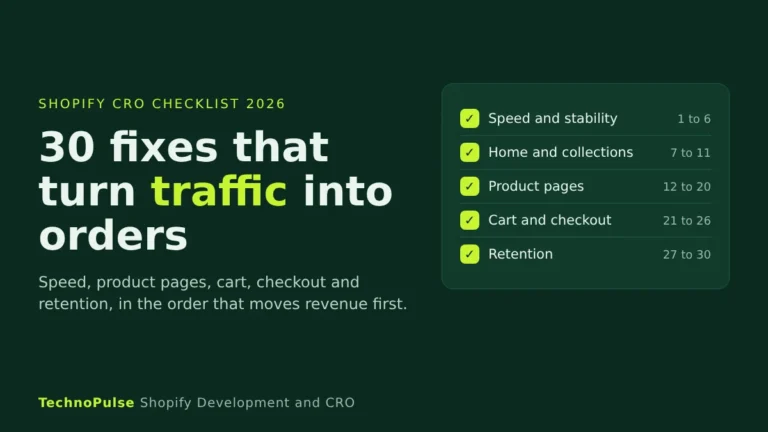
Pull these three ratios for the last 30 days, split by mobile and desktop, and compare them with the same period before. The biggest drop is your first project. Our Shopify CRO checklist lists the specific fixes for each step in the order we work through them.
What to do if your rate is below the median
- Confirm the data first. Check the September 2026 session update, broken tracking and bot traffic before you change anything.
- Fix speed on mobile. Slow product pages hurt every step that follows. Start with app scripts, image sizes and fonts. Our Shopify speed optimization work begins with exactly this audit.
- Make the product page answer the buying questions. Price, delivery time, returns, reviews and what is in the box should all be visible without scrolling far on a phone.
- Remove cart and checkout friction. Show shipping costs early, turn on express wallets, and keep the cart drawer focused on checking out.
- Recover the visitors you already paid for. Browse, cart and checkout abandonment emails and SMS bring back shoppers who were close to buying.
- Test one change at a time and measure revenue per session, not just conversion rate.
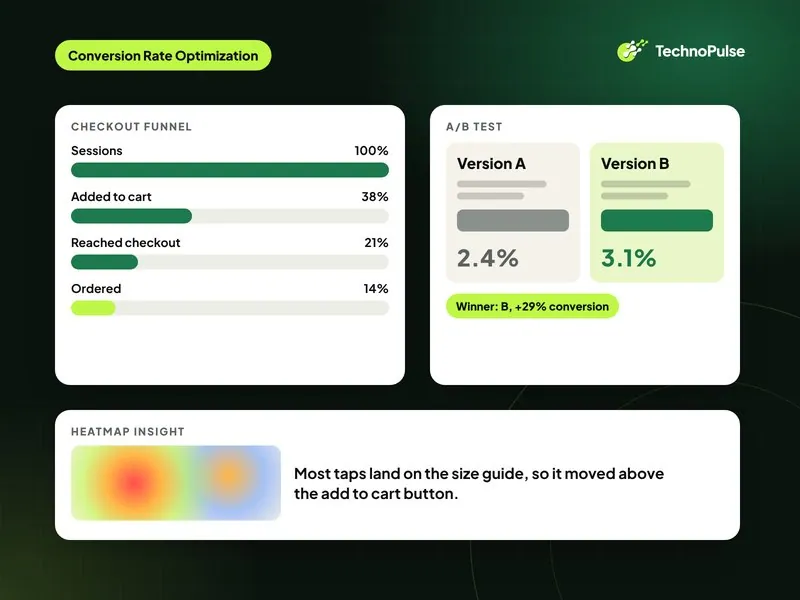
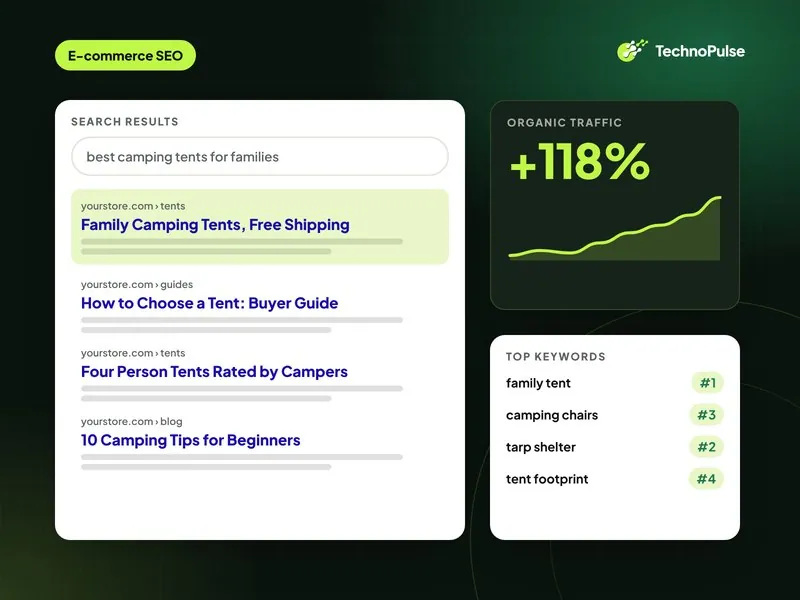
This is the order we follow in our Shopify CRO work. For one outdoor camping gear brand, a category where the median is only about 1.2 percent, that process lifted conversion by 49 percent and helped grow online sales 5.8 times. For a sportswear store, a 29 percent conversion lift was part of taking 2026 sales so far to 9.2 times all of 2024. On the retention side, a physician led supplement brand now gets 85 percent of its orders from returning customers, which is the kind of base that keeps conversion rates high in health and wellness.
Frequently asked questions
What is the average Shopify conversion rate?
The median Shopify store converts about 1.4 to 1.74 percent of sessions in 2026, based on Littledata and Shogun data. The mean is higher, about 2.5 percent, because a small number of very strong stores pull the average up.
Is a 2 percent conversion rate good for Shopify?
Yes, 2 percent is above the median for Shopify stores. Whether it is good for you depends on your category and price. For outdoor gear or electronics it is strong. For supplements or skincare it is slightly below the category median.
Is a 5 percent conversion rate realistic?
It is realistic for some stores, especially health, beauty and food brands with a large base of returning customers, but it is well inside the top 10 percent overall. Most stores should aim to beat their own category median first.
Why did my Shopify conversion rate change suddenly?
Check the date first. Shopify changed how sessions are measured between 21 and 23 September 2026, including filtering out bot sessions, which can move your rate without any change in orders. Also check for tracking problems, a new traffic source or a sale ending.
How often should I check my conversion rate?
Look weekly for big problems, but make decisions on at least 30 days of data, split by device and traffic source. Daily numbers are too noisy for most DTC stores.
Want to know where your store is losing sales?
We have helped more than 200 DTC brands since 2021 and hold a 5.0 rating on Google from over 40 client reviews. If you want a clear view of your own funnel, request a free Shopify store audit. We will show you which of the three funnel steps is costing you the most and what we would fix first.
Keep reading

Founder and CEO of TechnoPulse. Leads Shopify development, CRO and growth strategy for DTC brands in the US, Europe and Australia.
More about Haroon

 Technopulse
